Solar Radiation Calculation for Solar Panel Implementation
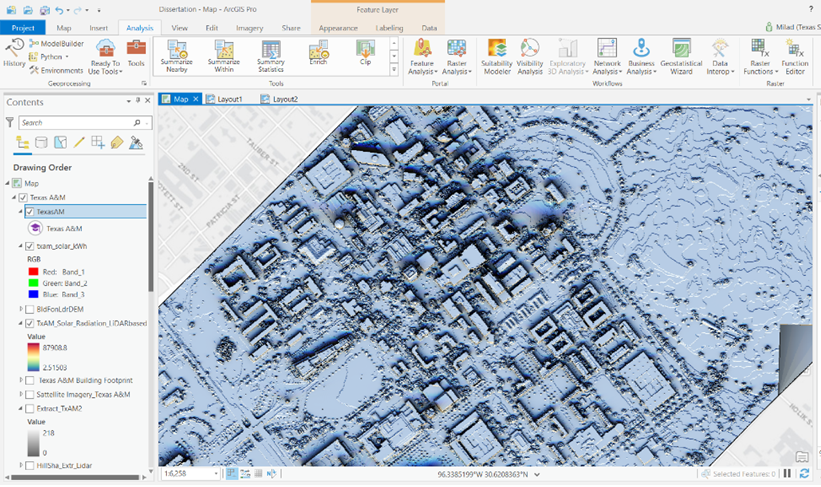
The underlying contribution of this study is given by the association between the financial analysis and implementation of GIS. While these two filed of study do not necessarily meet in overlapping areas of the disciplines mentioned, this study shows where and how it is possible to take the lead after applying a financial analysis, or vice versa, what can be added to a simple potential calculation of radiation accomplished in GIS. None of the current financial models, including the Cost of Renewable Energy Spreadsheet Tool (CREST), EDF Climate Corps Financial analysis version 2.0, NREL PV Operations and Maintenance Cost Model, nor System Advisor Model (SAM) include a thorough GIS modeling, or they limit the user to choose among average interpolated calculations. At the same time, a merely GIS approach does not consider the financial analysis of a proposed solar panel implementation as seen in Esri-based product, limiting the final result of such studies to a merely potential calculation of radiation and not a thorough financial assessment of electricity production.
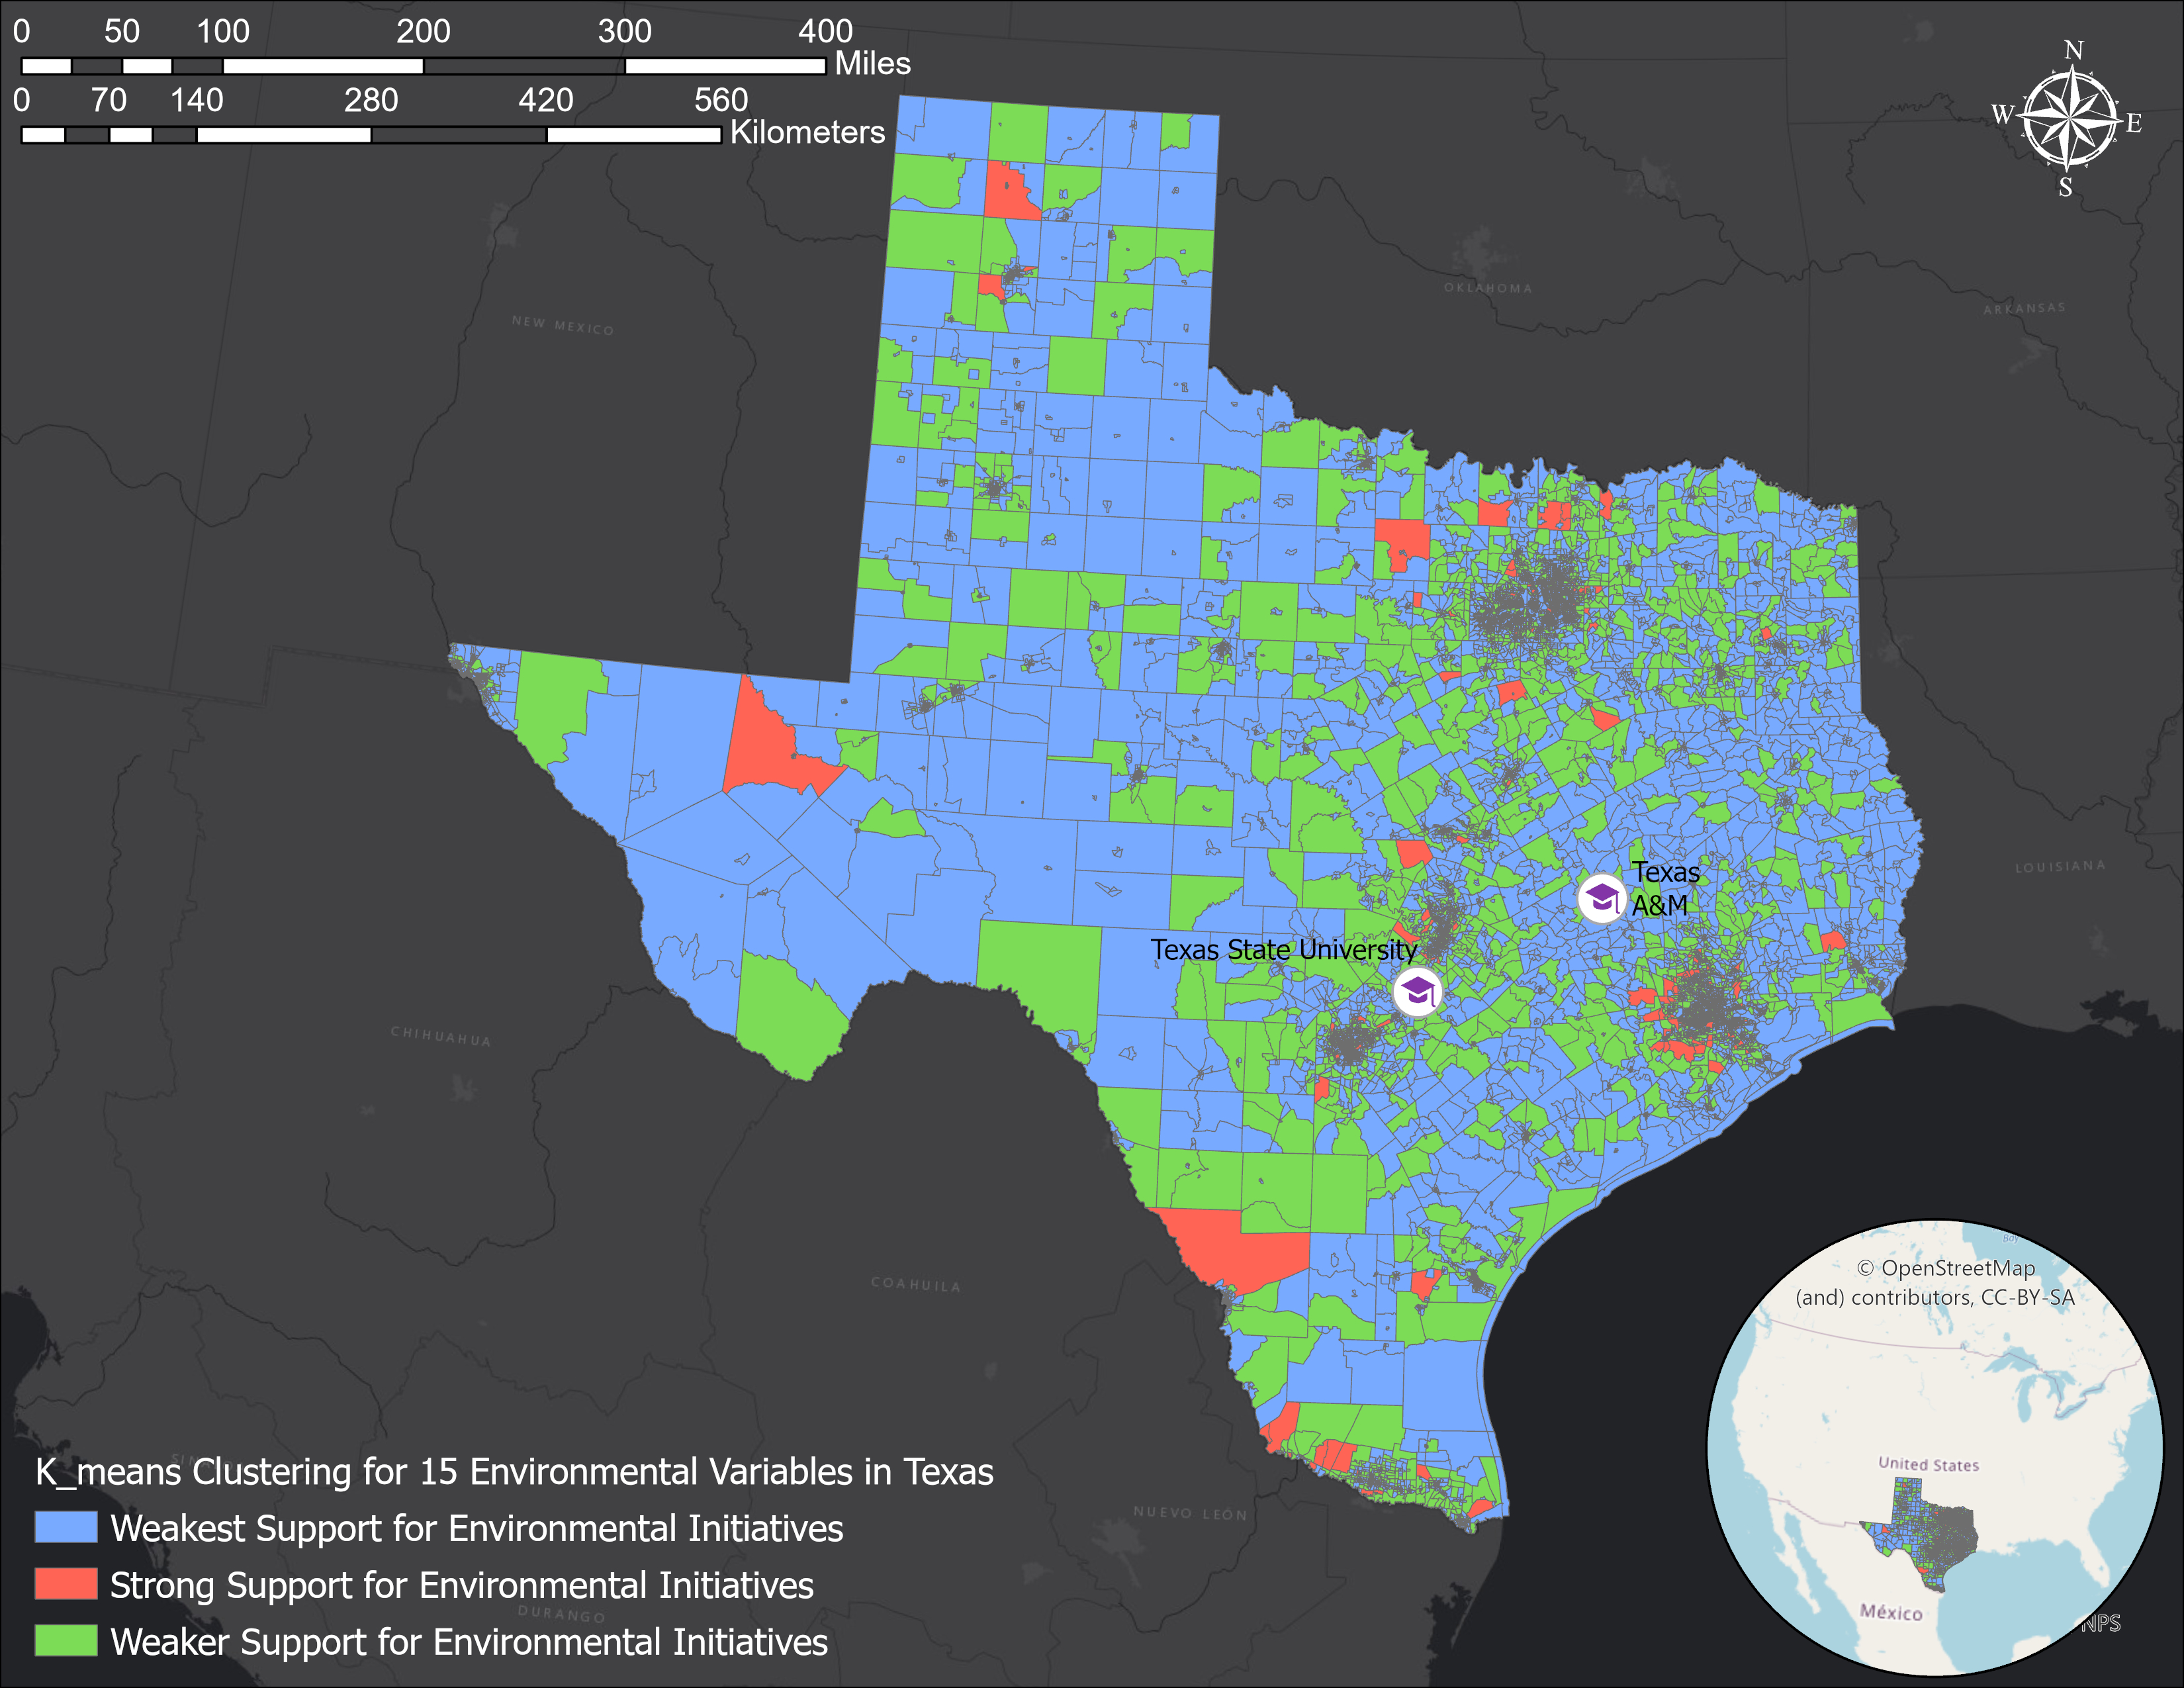
One significant advantage of using clustering to help summarize essential aspects of a place’s geographic context is that it can be applied to any analysis level at which data are collected. In that sense, clusters detected at multiple spatial resolutions can be combined into a multi-level framework for specifying and evaluating context. Using a specific example, consider a dataset on environmental policies and practices measured at the state level of analysis in the U.S. and a consumer survey that provides data on the environmental attitudes and preferences of a place’s residents down to the census tract unit of analysis. Performing cluster analyses on both datasets and combining the results would facilitate an investigation that identifies where (in geographic space) neighborhood environmental values and state environmental values and actions are aligned/congruent or at odds/incongruent.
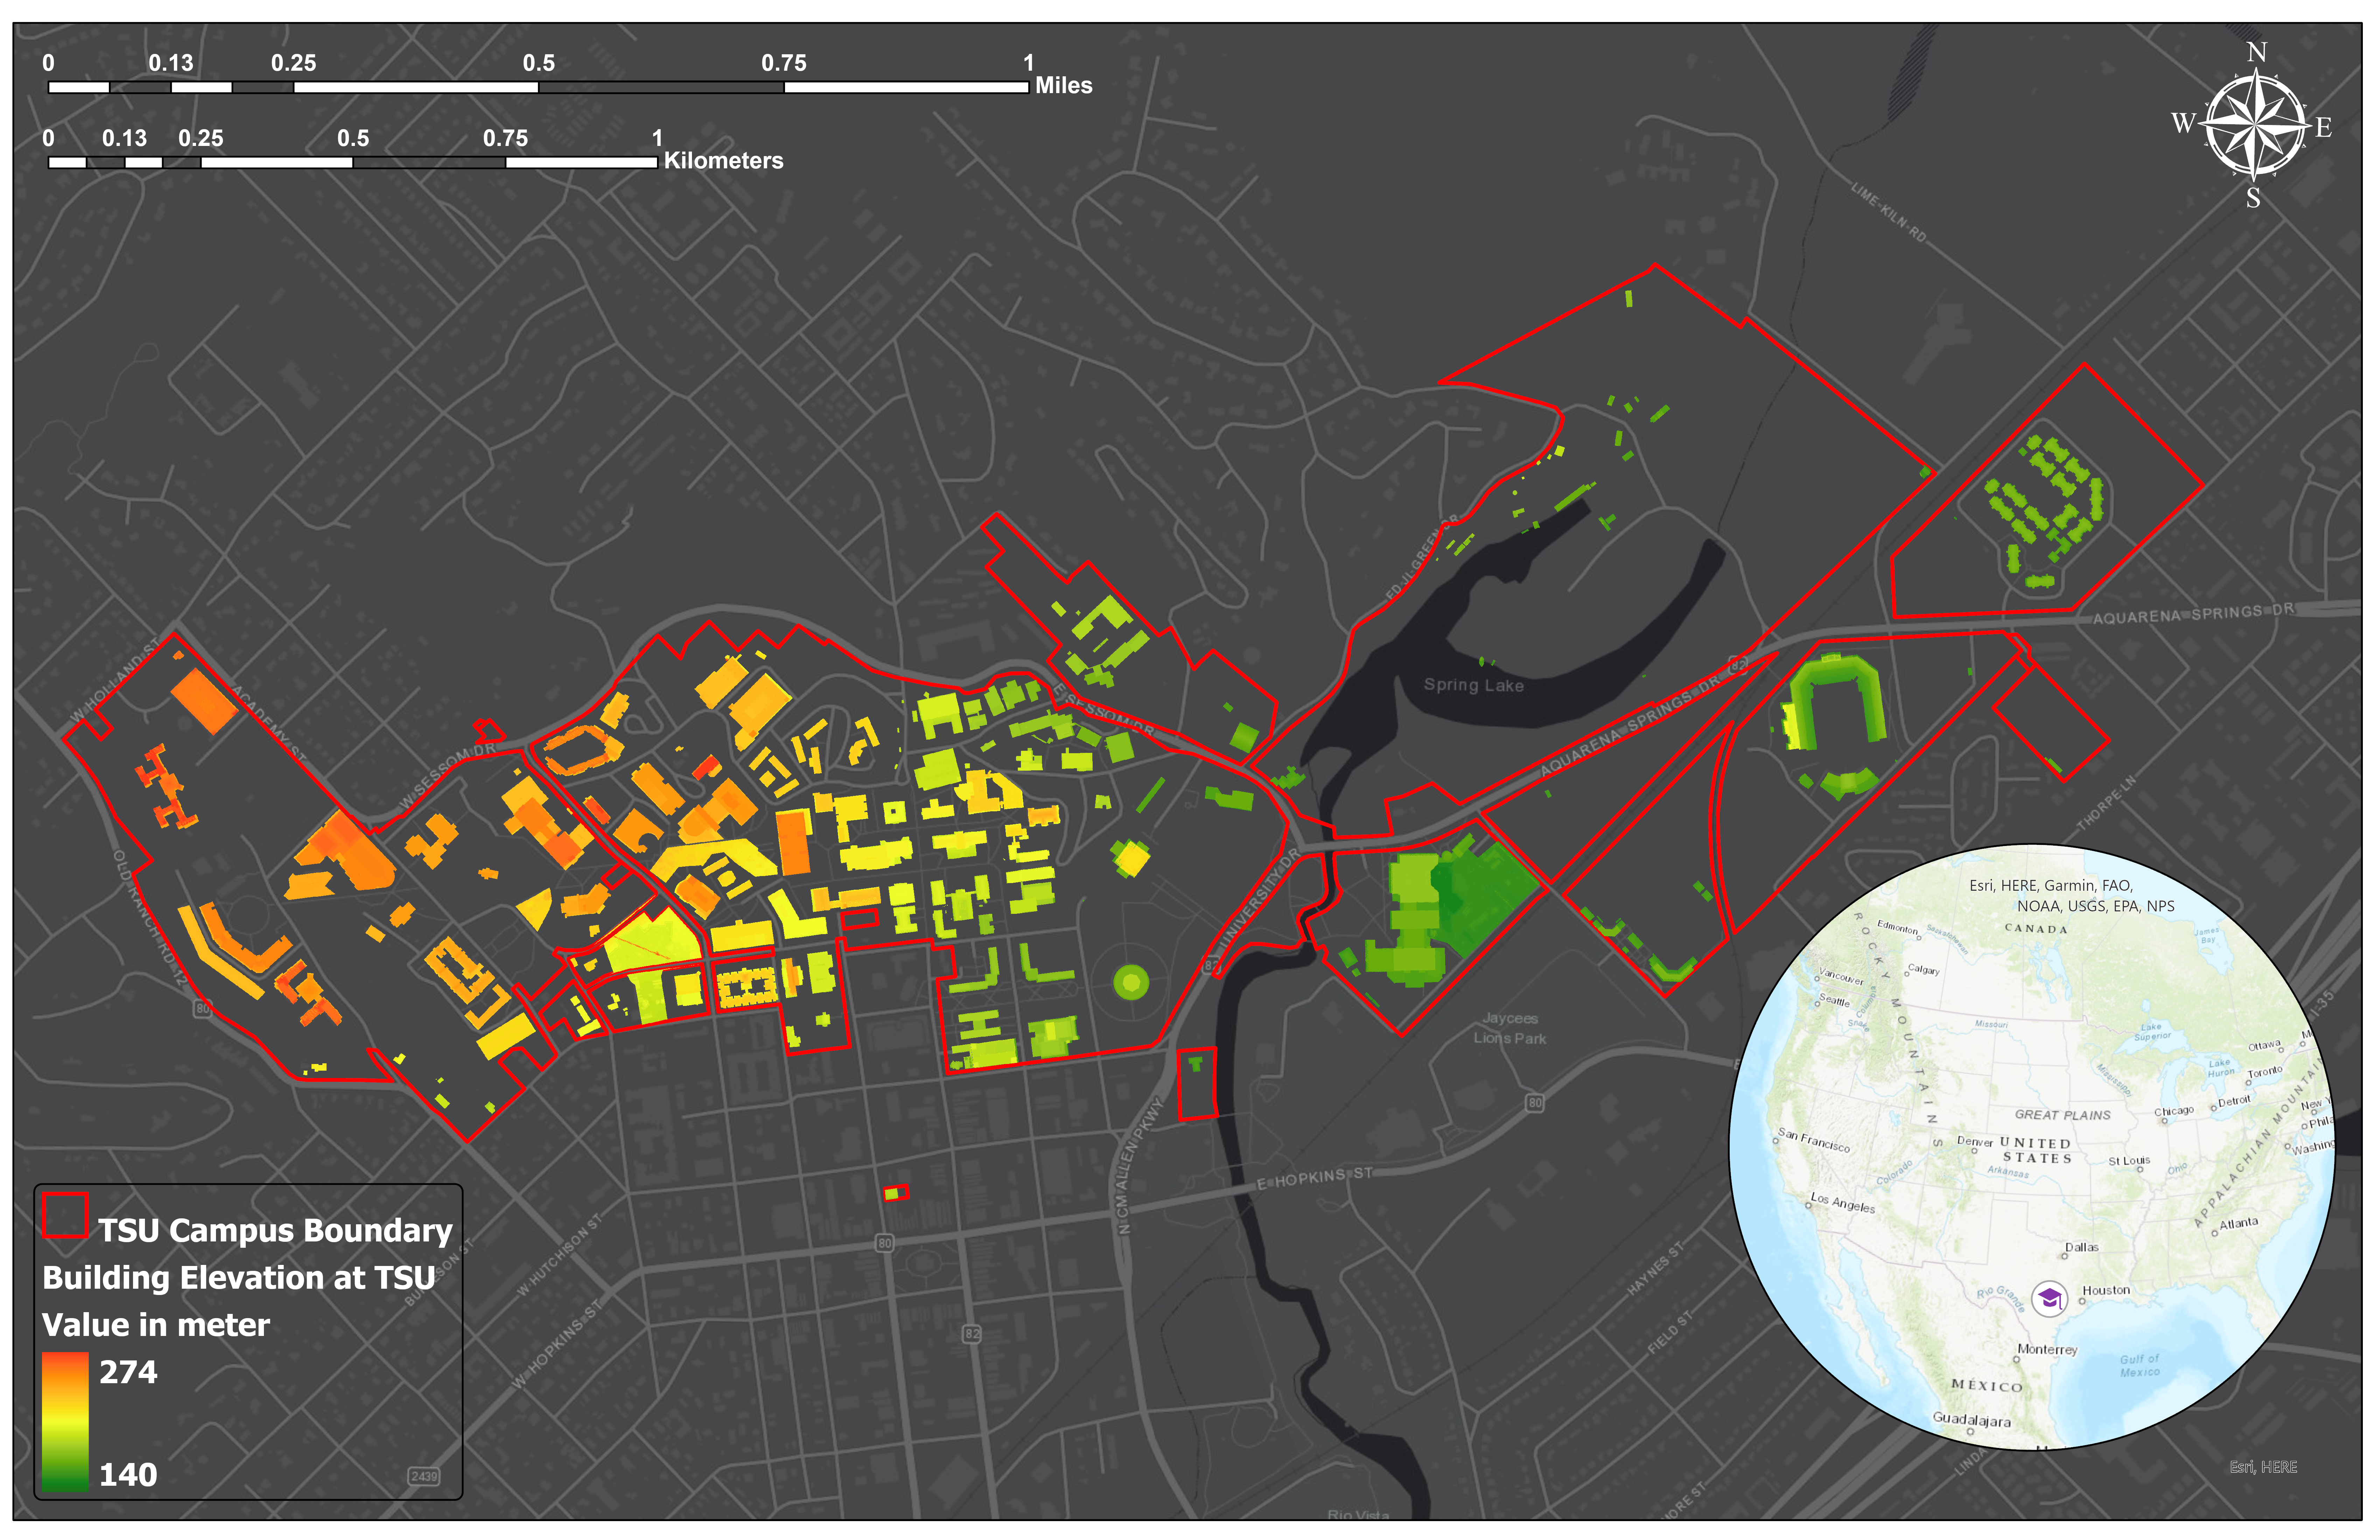
The process of creation of building footprint based on LiDAR includes value extraction from LAS, conversion to integer raster, extracting values based on building footprint. The LiDAR building footprint creation offers a more accurate buidling footprint extraction compared to low resulution DEM and avoids hours of editing sessions in vector data model.
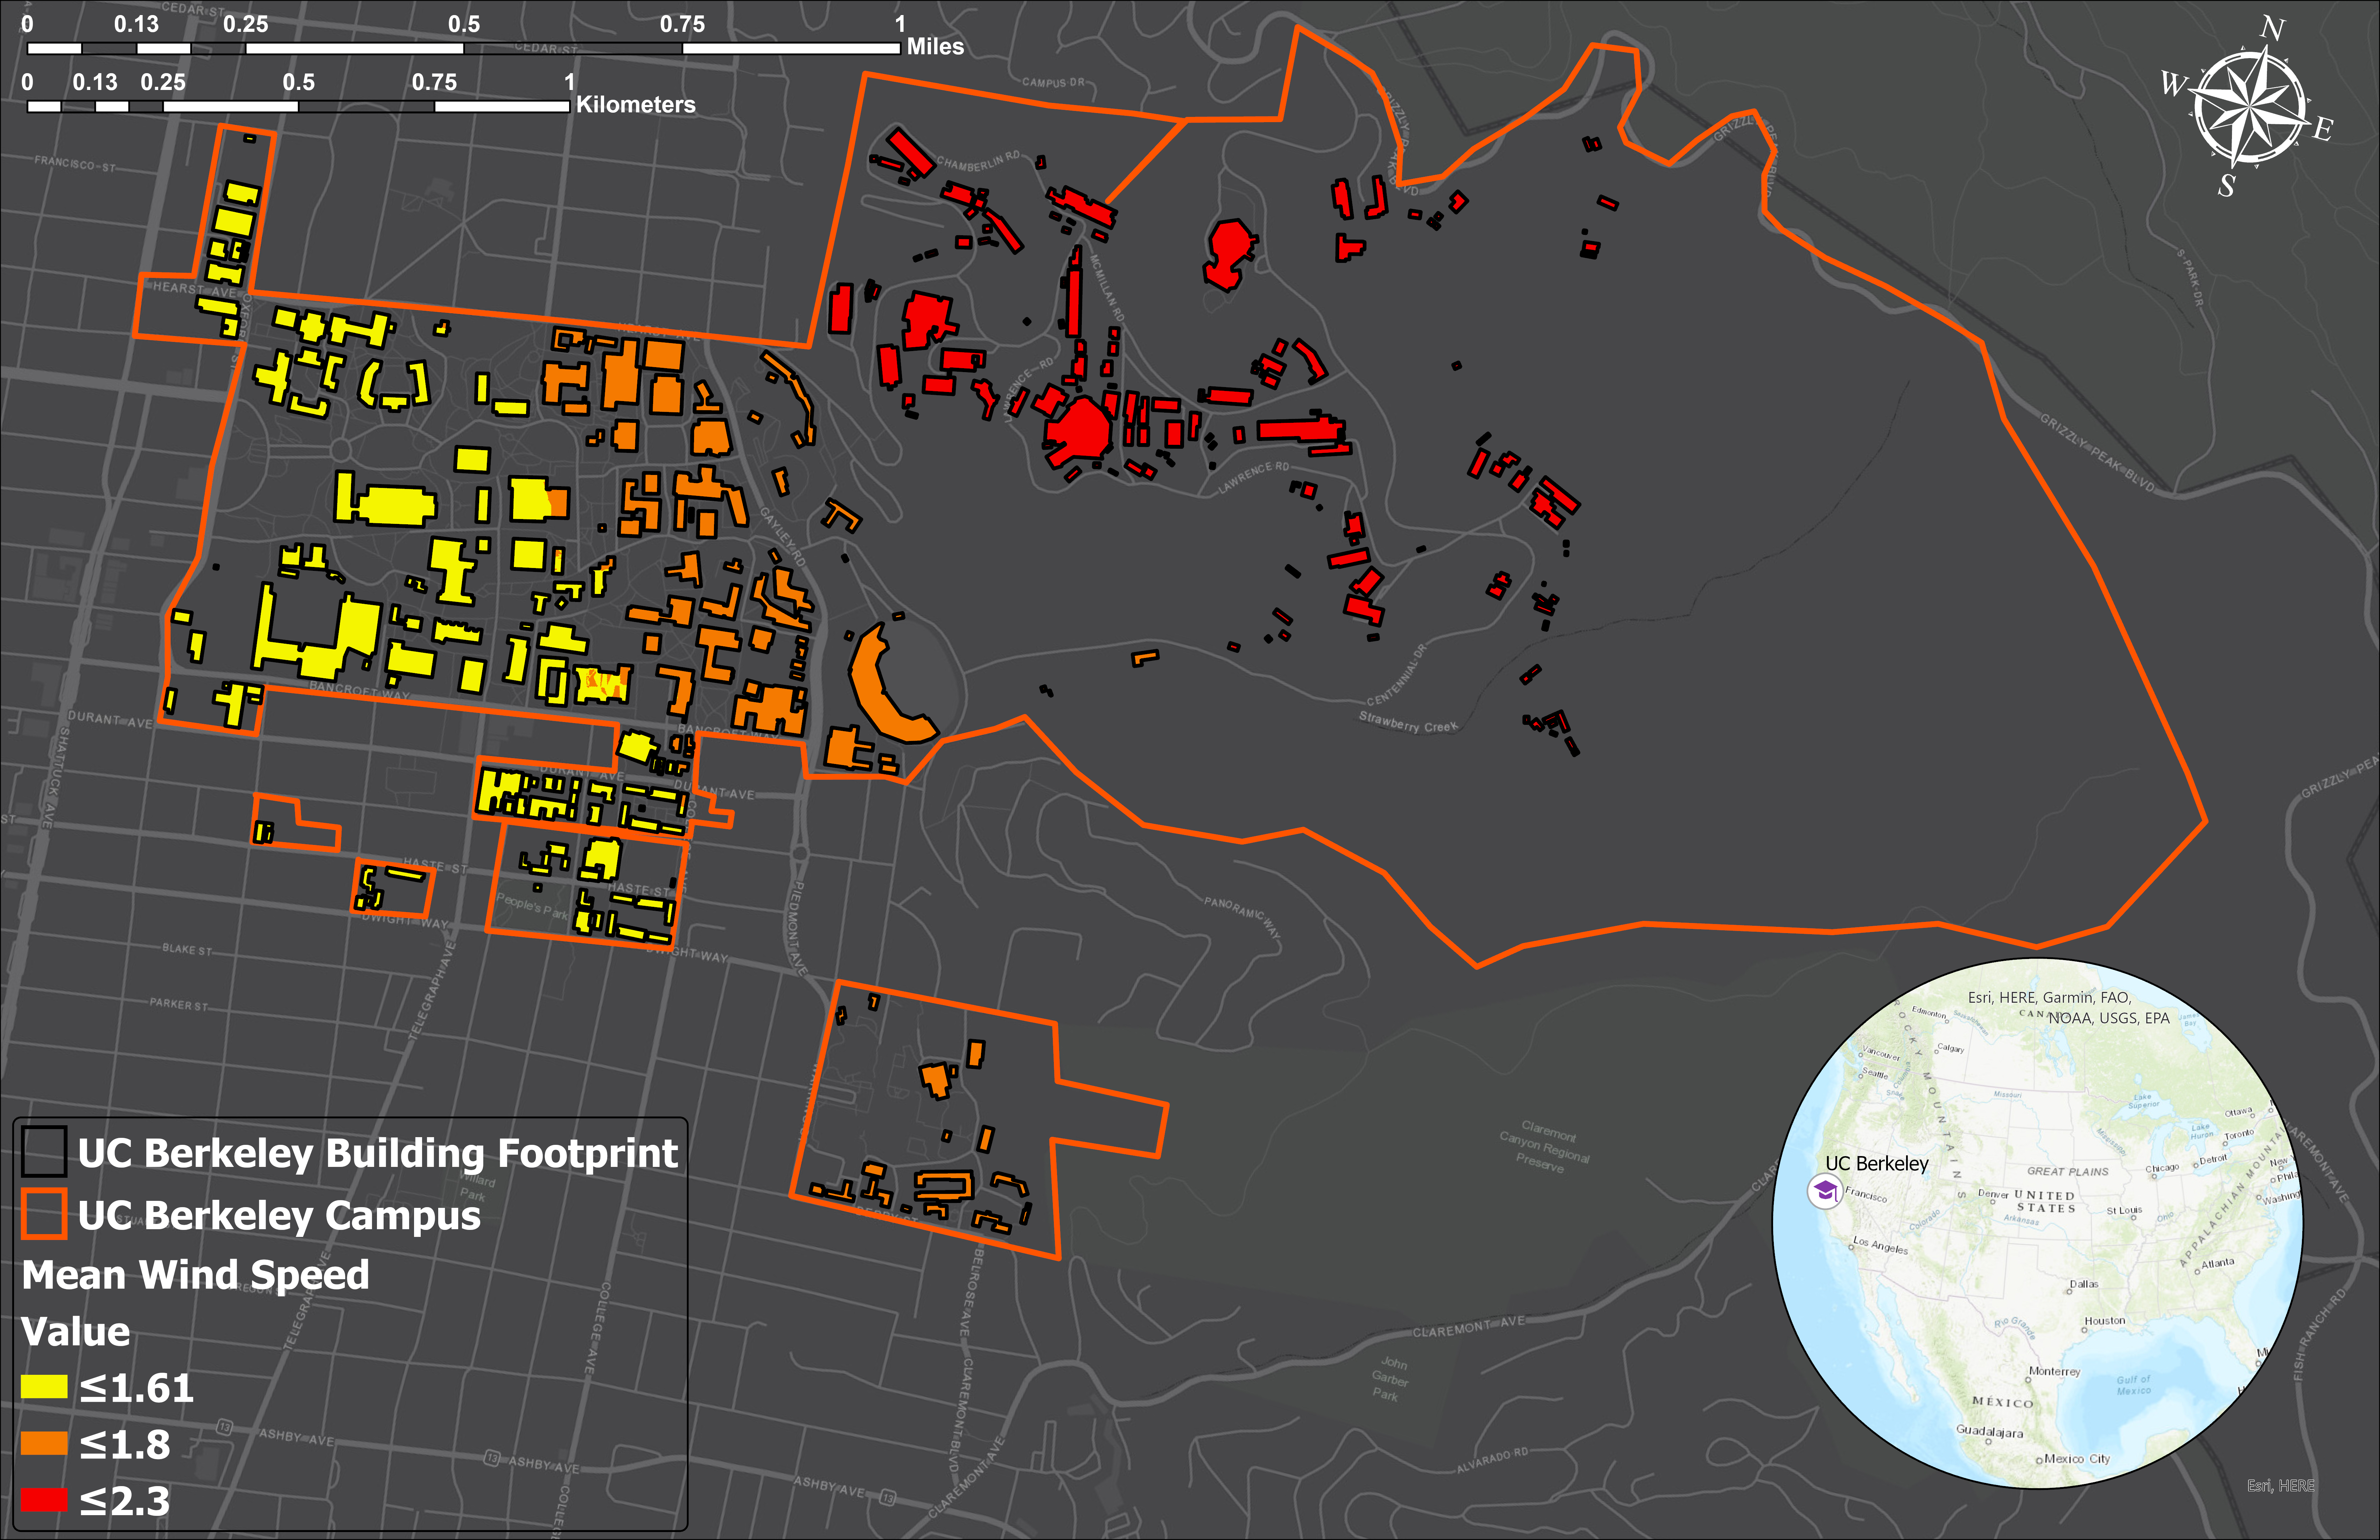
The financial and economic factors should be considered prior to the purchase and after site analysis to implement a micro wind system. The initial capital and setup costs are the most critical factors. In this study, both variables are included in the calculations as the total installed cost ($/kW). A fixed operational and maintenance expense has been considered for a kW of production every year ($/kW/yr).
I developed a method to create 3D layers using LiDAR datasets that can provide an alternative to extrusion in ArcGIS. Only points, lines, and polygons support extrusion while this method is dedicated to continious data such as LiDAR.
Big data provided by social media has been increasingly used in various fields of research including disaster studies and emergency management. Effective data visualization plays a central role in generating meaningful insight from big data. However, big data visualization has been a challenge due to the high complexity and high dimensionality of it. The purpose of this study is to examine how the number and spatial distribution of tweets changed on the day Hurricane Harvey made landfall near Houston, Texas. For this purpose, this study analyzed the change in tweeting activity between the Friday of Hurricane Harvey and a typical Friday before the event.
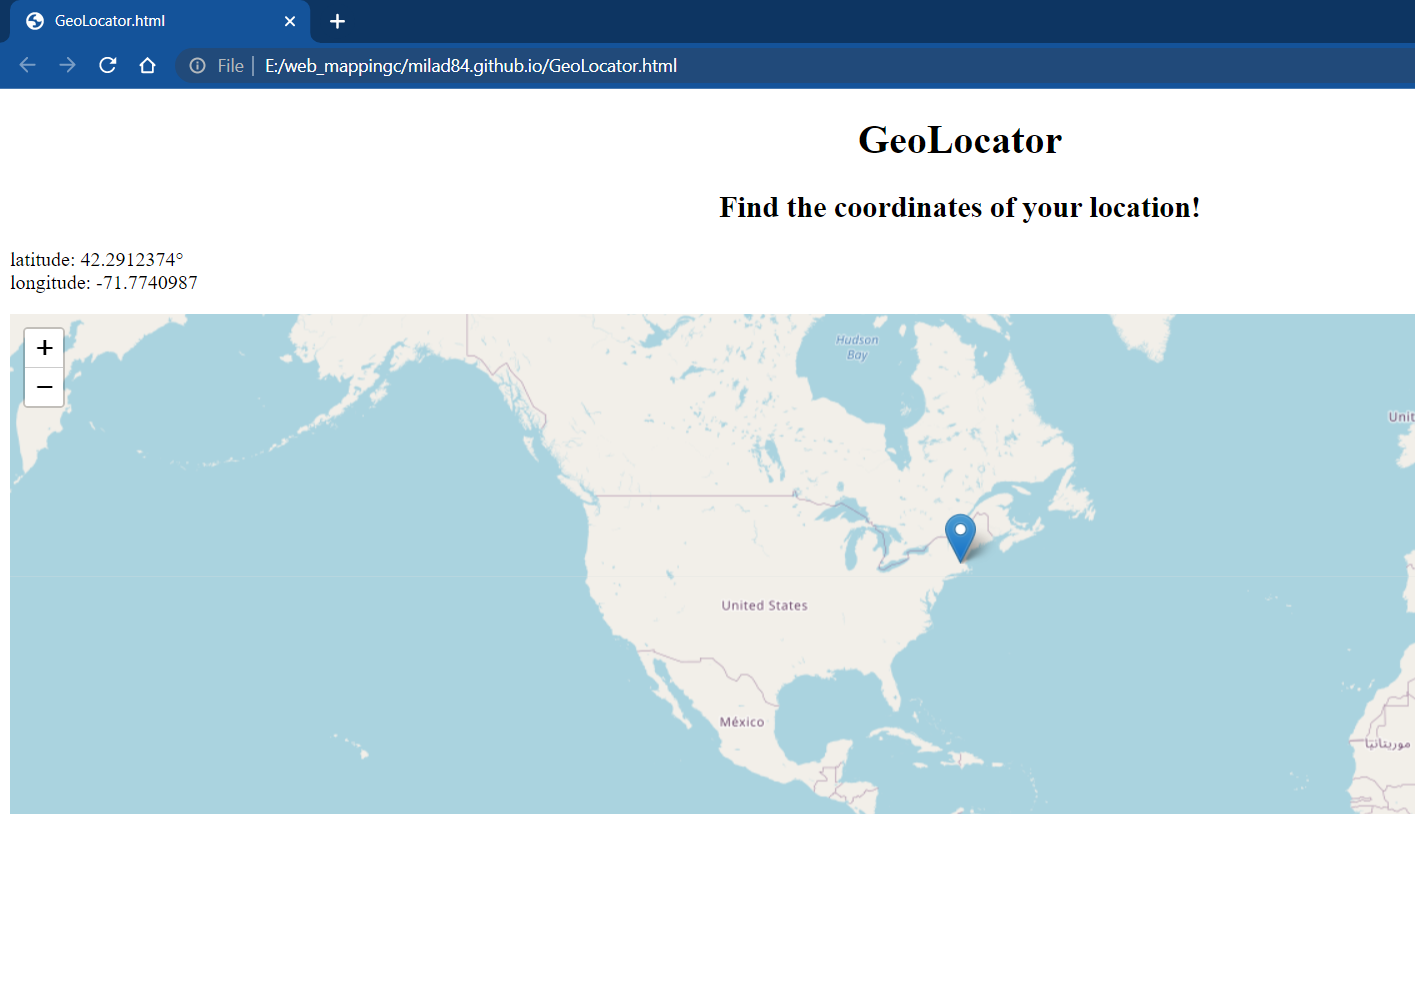
With the touch of a button, some enthusiasm, and the help of products and services like web mapping APIs, any student can create gorgeous maps. Whether the school project requires building a U.S.-location map or a global history project, interactive data visualizations help students understand the complete picture. Most mapping tools feature a way to import data, with plenty of examples, search functions, and instructions to help users. Web mapping APIs (Application programming interface) saves time and effort, allowing anyone to create maps without writing codes for essential map functions. Some APIs for web maps include Google Maps API, OpenLayers, ArcGIS, and Mapbox. I use these tools to teach younger generation and to enable them to share their findings with the entire world.
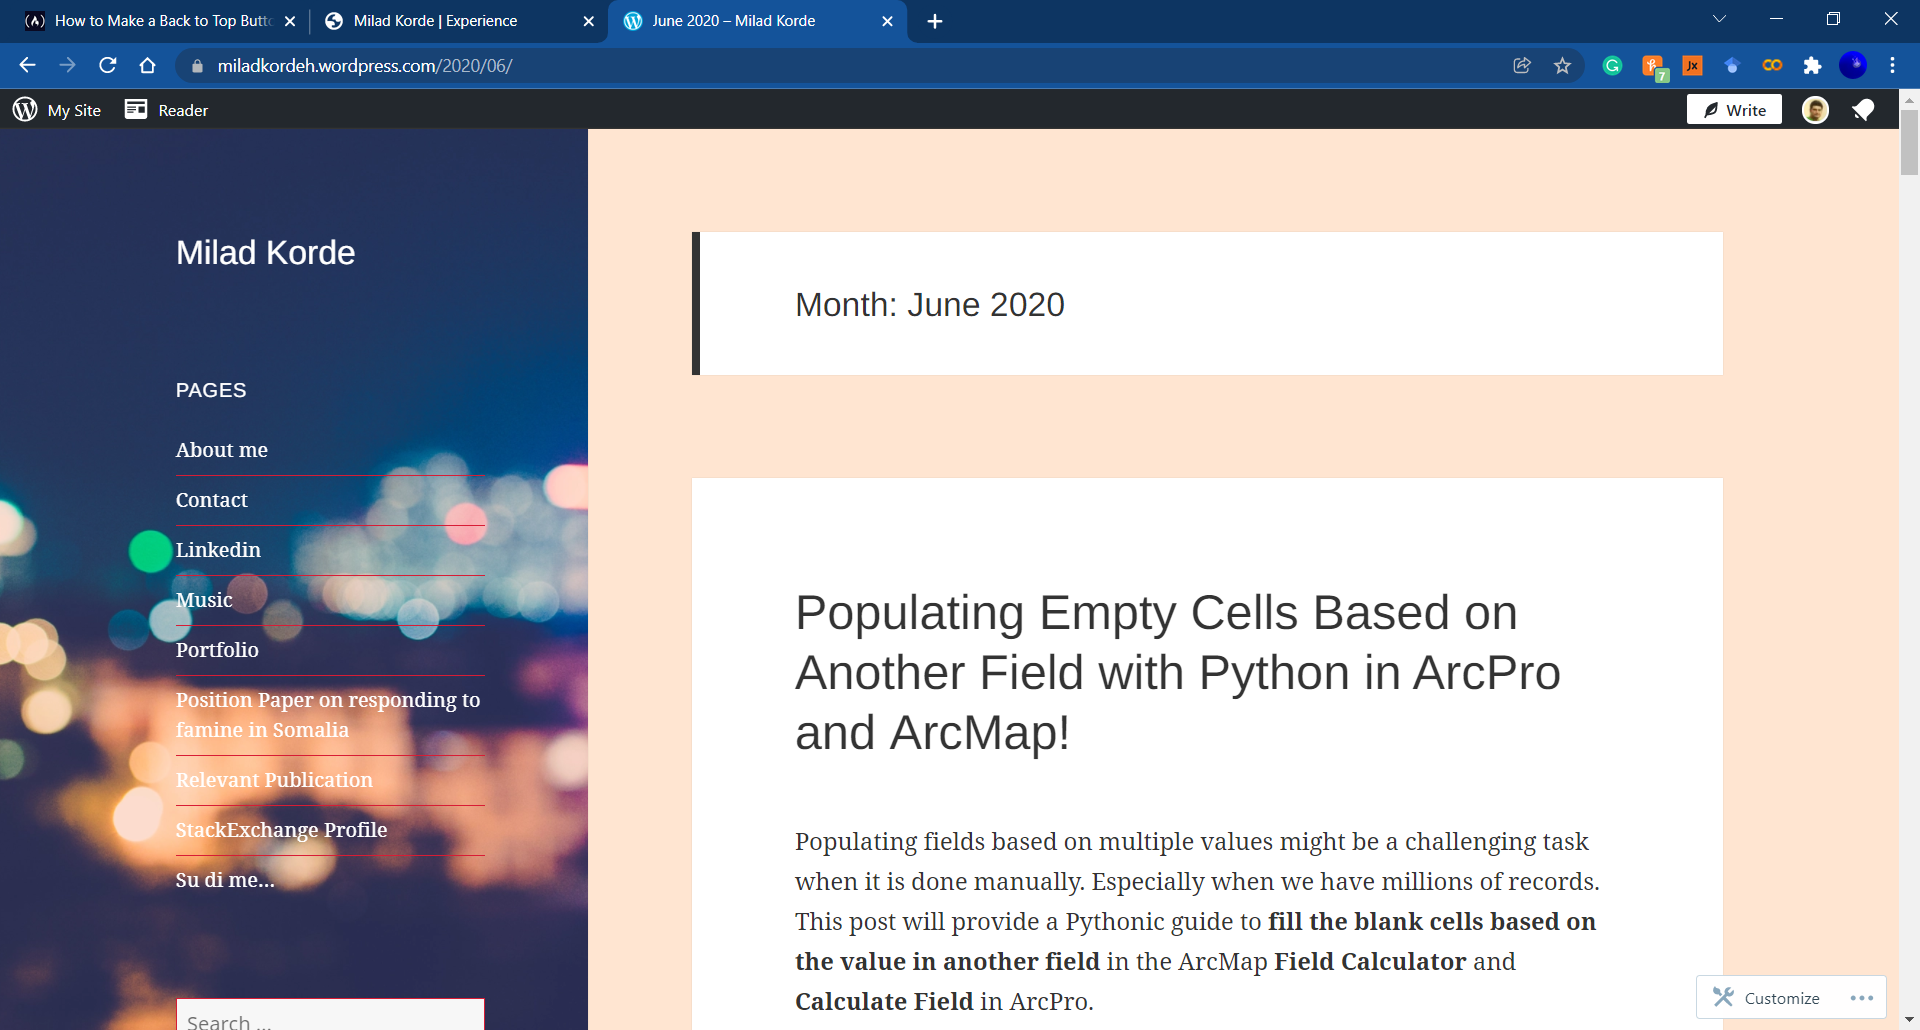
I love to share my knowledge with others and specifically with students and enthusiasts who might not find an immediate answer on google. In my web-log (https://miladkordeh.wordpress.com/) and Medium platform (https://medium.com/@milad.kordeh) I post solutions to challenges I faced in the past.